Fletcher’s Nomogram for LEV Design
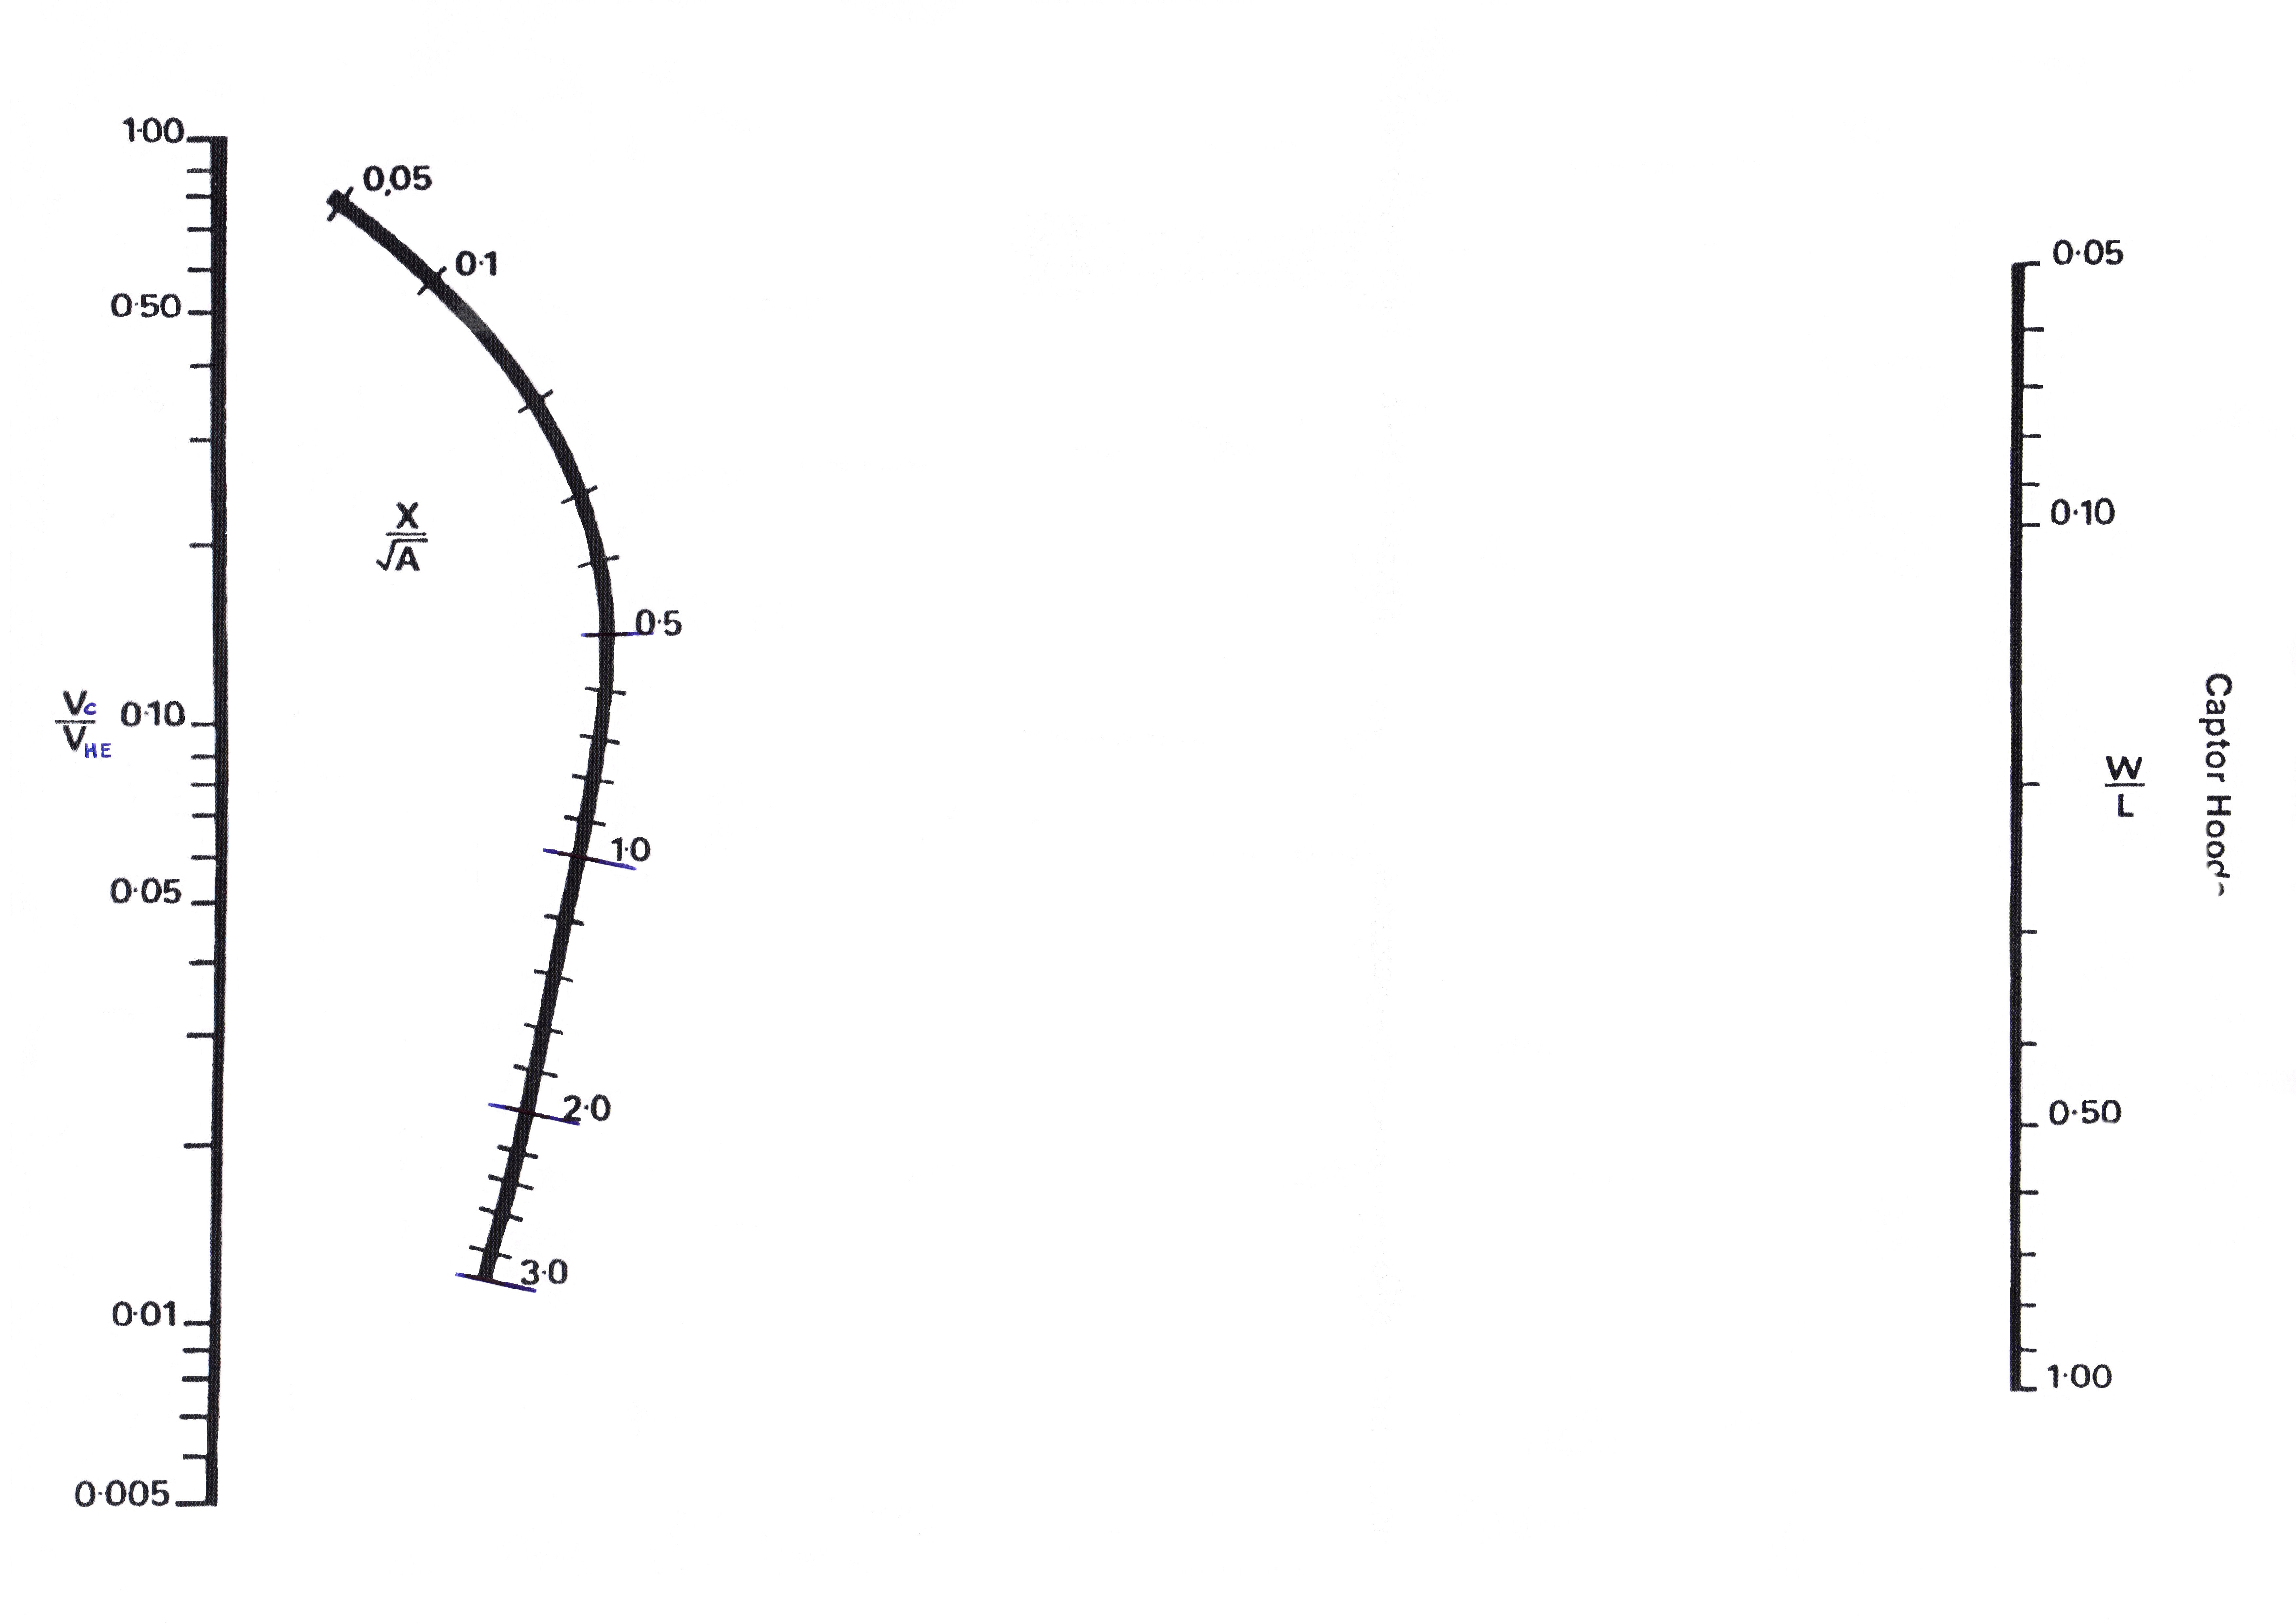
The Slide Rule of LEV Engineering Before Computers, Apps and Spreadsheets
LEVCentral Expert Commentary
Before spreadsheets, mobile apps and computer-based duct design software became commonplace, LEV engineers relied on a remarkable graphical calculation tool known simply as Fletcher’s Nomogram.
For decades, this chart was found folded inside the briefcases of LEV designers, commissioning engineers and occupational hygienists throughout the UK. It enabled engineers to determine pressure losses in circular ductwork quickly and with surprising accuracy—using nothing more than a ruler or straight edge.
Developed by Professor Brian Fletcher, one of the pioneers of modern industrial ventilation, the nomogram became one of the standard design aids taught on ventilation engineering courses and used extensively throughout industry. It removed the need to repeatedly solve lengthy mathematical equations, allowing engineers to estimate friction losses graphically while designing or balancing duct systems.
Although largely replaced today by software, spreadsheets and smartphone applications, Fletcher’s Nomogram remains an important part of LEV history and is still an excellent educational tool for understanding the relationship between airflow, duct diameter, air velocity and pressure loss.
View Fletcher’s Nomogram
What is a Nomogram?
A nomogram is a graphical calculating device.
Instead of performing mathematical calculations manually, the user simply joins known values using a straight edge to determine an unknown value from the chart.
In the case of Fletcher’s Nomogram, the engineer could determine relationships between:
- Airflow
- Duct diameter
- Air velocity
- Friction pressure loss
The result could then be used during the design of duct systems or to estimate the resistance of existing installations.
Key Learning Points
The nomogram allows engineers to estimate:
- Air volume flow rate.
- Duct air velocity.
- Circular duct diameter.
- Friction pressure loss.
- Pressure loss per metre of duct.
- The relationship between duct size and system resistance.
- The effect of changing airflow on pressure loss.
- The influence of duct sizing during LEV design.
It also provides an excellent visual demonstration of why increasing duct velocity significantly increases friction losses.
Source Information
Original Developer: Professor Brian Fletcher
Resource Type: Engineering Nomogram
Primary Topics: LEV Design, Duct Design, Pressure Loss Calculations, Ventilation Engineering, Fan Selection, Airflow Calculations
Audience: LEV Designers, Commissioning Engineers, Occupational Hygienists, Mechanical Engineers, Students and BOHS Candidates.
LEVCentral Perspective
Whilst modern engineers naturally reach for Excel, dedicated LEV software or smartphone apps, there remains considerable educational value in learning how Fletcher’s Nomogram works.
Unlike computer software, a nomogram forces the user to understand the relationship between the variables.
As airflow increases:
- air velocity increases;
- friction losses rise rapidly;
- larger fans may be required; and
- energy consumption increases.
These relationships become immediately obvious when using the chart.
Many experienced engineers who began their careers before personal computers still speak very fondly of Fletcher’s Nomogram. It became an essential part of everyday LEV design and was often quicker than reaching for a calculator.
Although few engineers now carry laminated nomograms in their toolkit, understanding how they work provides valuable insight into the mathematics that underpins modern duct design software.
Further Resources
- OXYL8 LEV App – Includes a growing range of practical LEV calculators for engineers and students, bringing many traditional ventilation calculations to your smartphone. Additional calculation modules continue to be developed.
- Basic LEV Maths – Fan Laws (OXYL8 / LEVCentral)
- ACGIH – Industrial Ventilation: A Manual of Recommended Practice for Design
- HSG258 – Controlling Airborne Contaminants at Work
Recommended Learning
- M505 Control of Hazardous Substances
- P600 Methods for Testing Performance of LEV
- P601 LEV Thorough Examination & Testing
- P602 LEV Basic Design Principles
- P604 LEV Commissioning & Performance Evaluation
Thought Leadership
Fletcher’s Nomogram reminds us how much engineering has changed over the last fifty years.
What once required carefully drawn nomograms, slide rules and engineering handbooks can now be completed almost instantly using specialist software or a mobile phone. Yet the mathematics has not changed. Every spreadsheet, duct calculator and smartphone app still relies on exactly the same physical relationships that Fletcher represented graphically.
From a LEVCentral perspective, the nomogram remains more than a historical curiosity. It is a superb teaching aid because it encourages engineers to think about why pressure losses change rather than simply accepting whatever figure a computer produces. Understanding those underlying relationships is one of the hallmarks of a competent LEV designer.
Perhaps the greatest tribute to Professor Fletcher is that, although few engineers now use his nomogram in day-to-day design, the principles it illustrates continue to underpin every modern LEV calculation tool—including today’s spreadsheets, commercial design software and the expanding range of calculations within the OXYL8 LEV App.
Working Through the Nomogram
For Captor Hoods – Fletcher’s Nomogram chart for manual calculations of Hood Entry Velocity required to achieve a nominated minimum Captor Velocity at a chosen distance out from the hood (Captor Distance).
All units must be in metric
- Select hood dimensions and calculate Aspect Ration (small dimension divided by large)
- Mark Aspect Ration on right hand axis of chart
- Calculate hood area
- Take square root of hood area
- Decide Captor Distance required (X) on chart
- Divide Captor Distance (X) by the Square root of the hood area (A)
- Mark this figure on the middle line of the chart
- Draw a line with a ruler from the Aspect Ratio line through the middle line until it ‘hits’ the left hand vertical line
- This is the ration of the Captor Velocity divided by the Hood Entry (Face) velocity
- To get the Hood Entry velocity required divide your chosen Captor Velocity (from tables in HSG258) by the value you have just obtained from your drawn line where it intersected the vertical left hand chart line

Alternatively we have Fletchers Nomogram with notes (a how to guide):


You must be logged in to post a comment.